
Appearance
Dashboard
Metrics provide the At-a-Glance overview of the performance and statistics of your AireGlu environment.
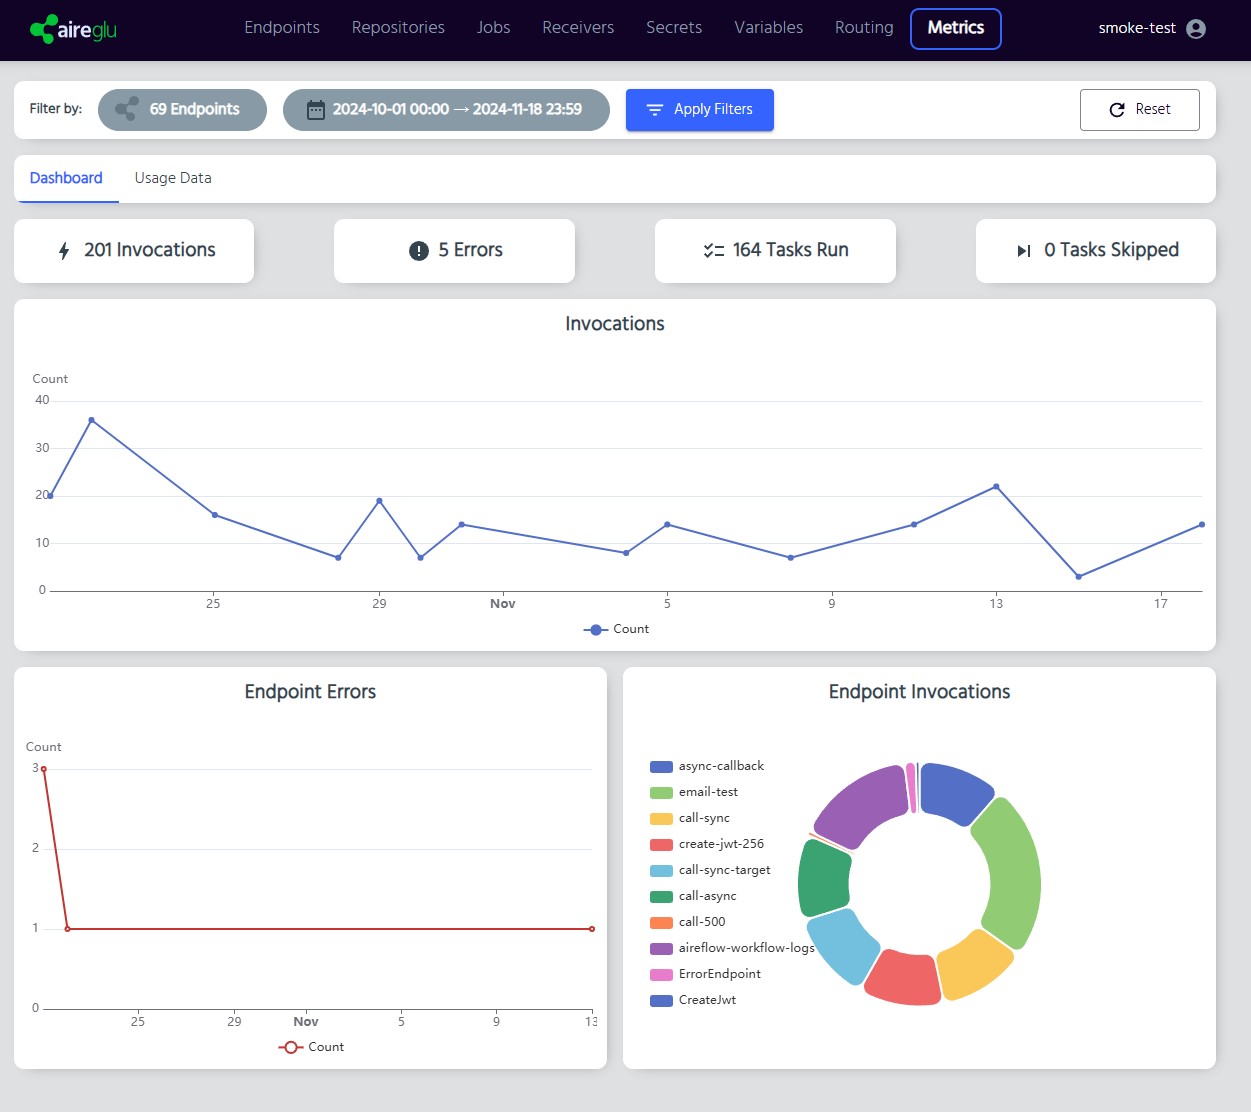
From the landing zone, you can quickly see the overall numbers, and filter this view based on Endpoint or date and time.
By clicking on the Usage Data tab at the top of the page, just underneath the filters, you can pull up a more detailed table of requests and actions. You can filter this by particular outcomes and actions, endpoints, time, transaction id, IP address and HTTP method. You can also access this page in a pre-filtered state by clicking on the various statistics from the landing zone. For instance, if you clicked on the Invocations stat, you would be pre-filtered to Endpoint Invocation actions.
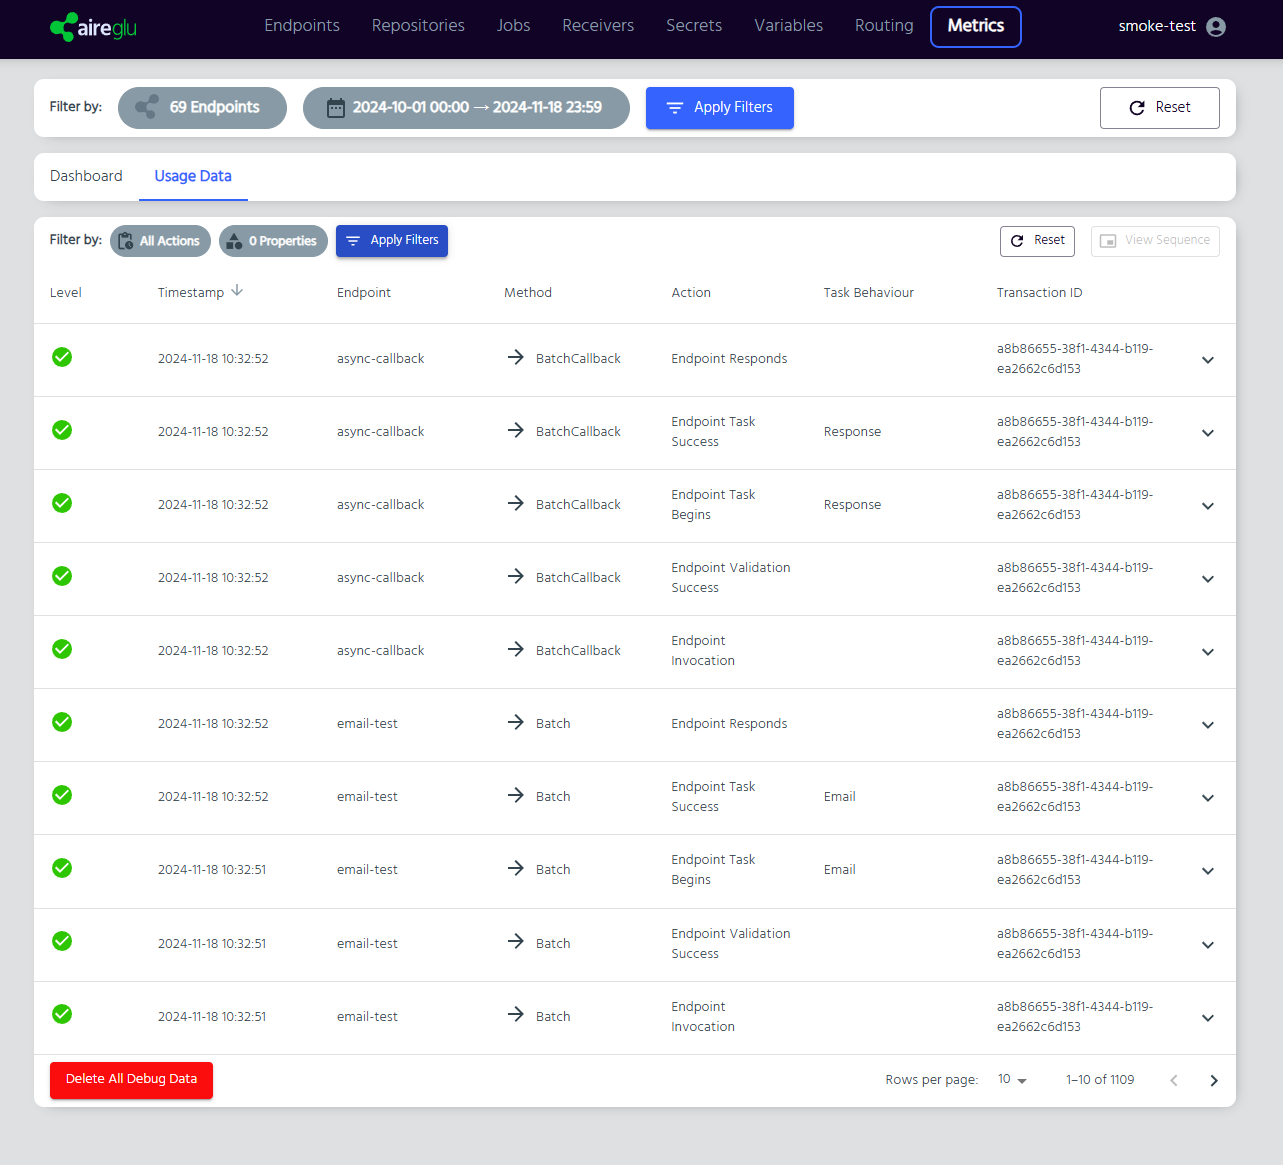
By clicking on the data row, it will display additional contextural information. A debug icon next to the expand row icon indicates that the Endpoint was run in Debug mode at the time it was used and there will be additional context information avaialble.
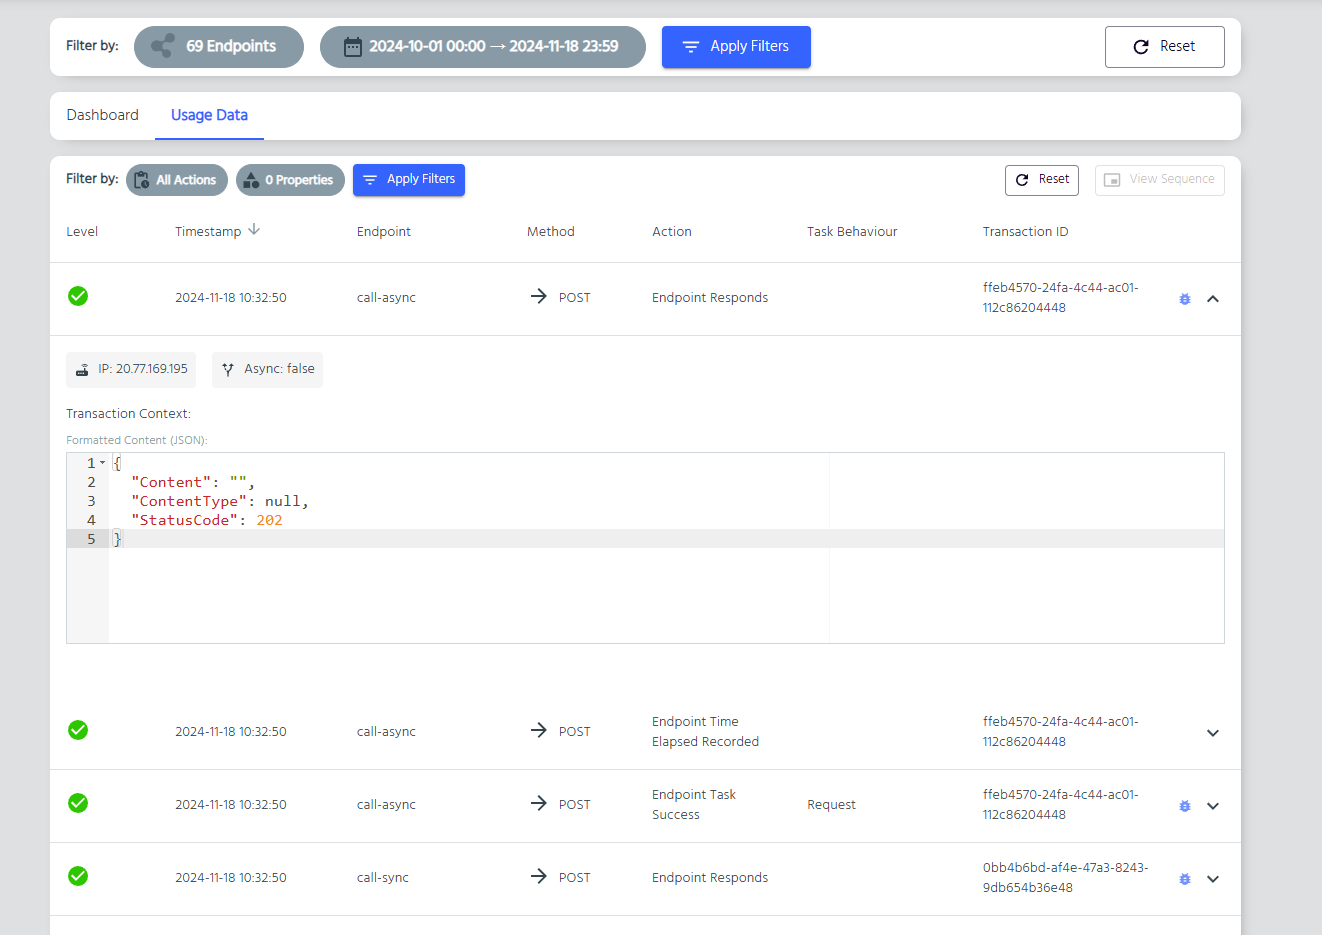
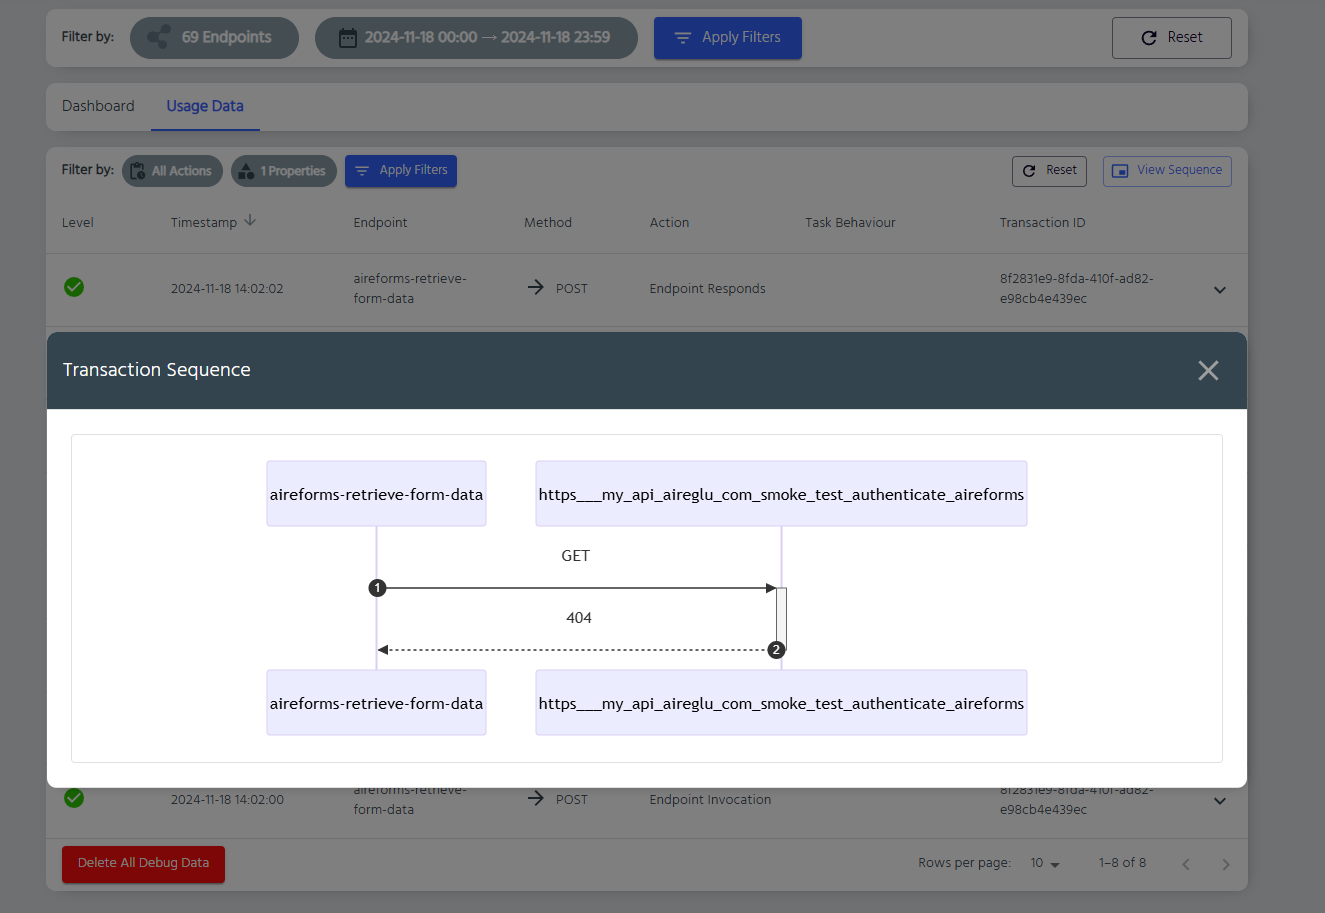
Additionally, by clicking on the transaction ID, you can view the full endpoint flow and inspect the results of each stage. This is the same as filtering by a specific Transaction ID. In this view you can also see a visual representation of the flow of data within the endpoint, by clicking on the the View Sequence button at the top of the data table.
Debug data is persisted for a period of 30 days, after which it is cleared. If you wish to perform this action sooner you can click the Delete All Debug Data at the bottom of the data table. Note, this will delete all debug data, you filter settings will be ignored.